Texture analysis was performed by XRD
2023-10-27 10:00Inorganic materials account for the majority of all solid materials, of which single crystals are few, and the vast majority of materials are used in polycrystalline form; In polycrystalline materials, in theory, the crystallographic orientation of each grain is completely disordered and randomly distributed. However, many materials through rolling, extrusion and other deformation processes, or even without deformation, the grains in the polycrystal show more or less statistical uneven distribution, this phenomenon is called preferred orientation, this organizational structure is called texture.

1. Study the texture reasons
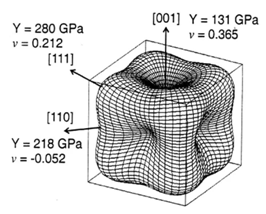
a. The existence of texture will lead to the anisotropy of material properties;
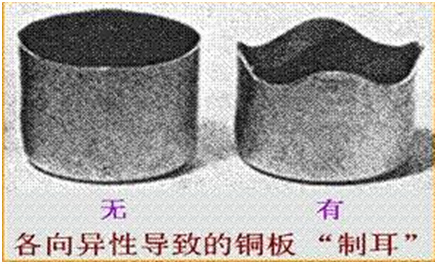
b.the existence of texture, sometimes harmful, such as the appearance of "ear" during processing;
c. the existence of texture, sometimes is advantageous, for example, if a large number of {111} surface texture is formed in the steel plate, the deep stamping performance of the material will be greatly improved.
Therefore, the in-depth texture research is of great guiding significance for the research and development of new materials and product process control.
2. Texture research methods
Current texture analysis methods, mainly XRD and EBSD, both have advantages and disadvantages, and many times the two are often combined:
The XRD sample is simple and the measurement results are macroscopic.
The EBSD method is complex and the measurement results are microscopic, but EBSD can give the distribution of crystal orientation directly.
3. Principle of XRD texture analysis
If the grains in the crystal sample show a complete random orientation, the strength is evenly distributed:
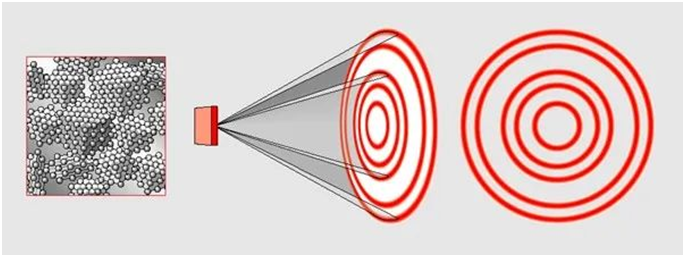
If there is texture in the crystal, it will inevitably cause fluctuations in the diffraction intensity, and these intensity changes reflect the uneven distribution of grain orientation in space:
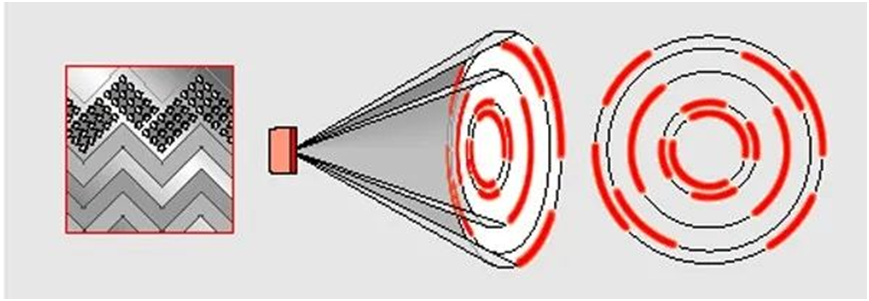
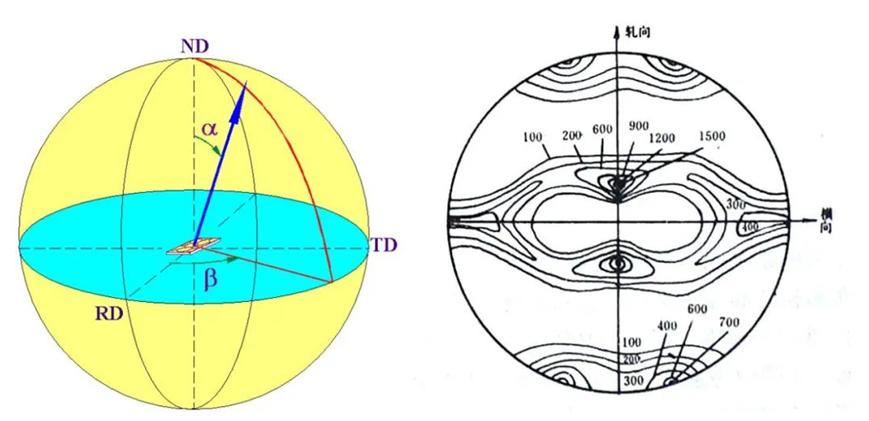
Therefore, as long as the diffraction intensity at each Angle a and b is measured, the polar map can be obtained by the polar radiation red plane projection. Calculate according to the measured polar diagram, you can get the inverse polar diagram, ODF diagram, texture quantification and other information:
