Powerful analysis software
2023-08-25 10:00一、Software Features Description
This procedure is a self-developed procedure. It contains a variety of quantitative analysis functions developed by ourselves, which are in accordance with the diffraction theory and are calculated by integral intensity.For example, this procedure contains the function of full spectrum peak fitting, separation and quantification, which can be correctly quantified even when the linewidth of each phase is different; in that case of an integral intensity quantitative method function that can conveniently and automatically eliminate interference of overlapping peak of the present phase and other phase and is not affected by different linewidth of each phase, for example, complete PDF file calculation spectrum combination full spectrum fitting method and user-defined card file calculation spectrum combination full spectrum fitting method. All of the above methods use the concept of integral intensity for quantitative analysis, and can be quantified by full spectrum fitting under the condition of different linewidth of each phase without involing structure. The interference of overlapping peaks can be eliminated, and the influence of preferred orientation can be reduced or elimited. The software package can use PDF database or COD powder diffraction powder diffraction database based on COD crystallography database for phase quanlitive and quantitative analysis.
二、This XRPD Analysis Package Features
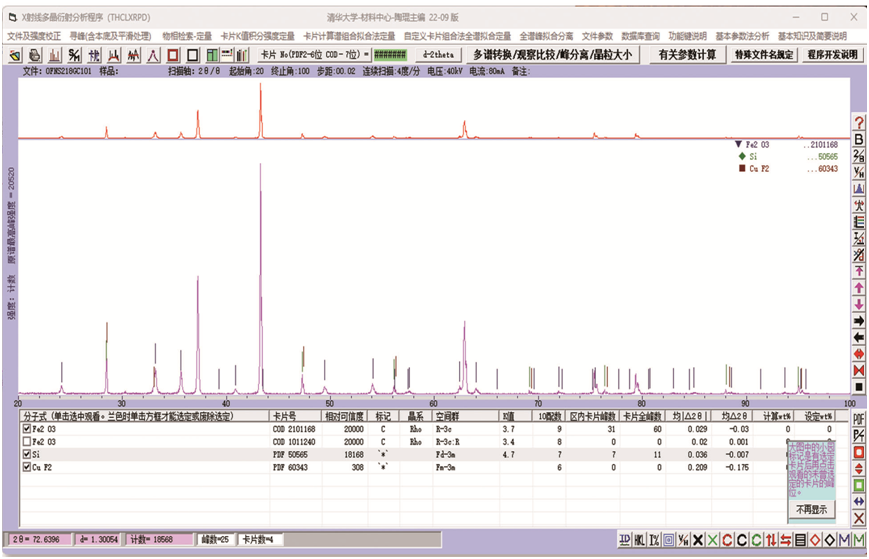
(1)PDF card calculation spectrum combination full spectrum fitting quantitative analysis.
(2)Self-defined card calculation spectrum combination full spectrum fittting quantitative analysis.
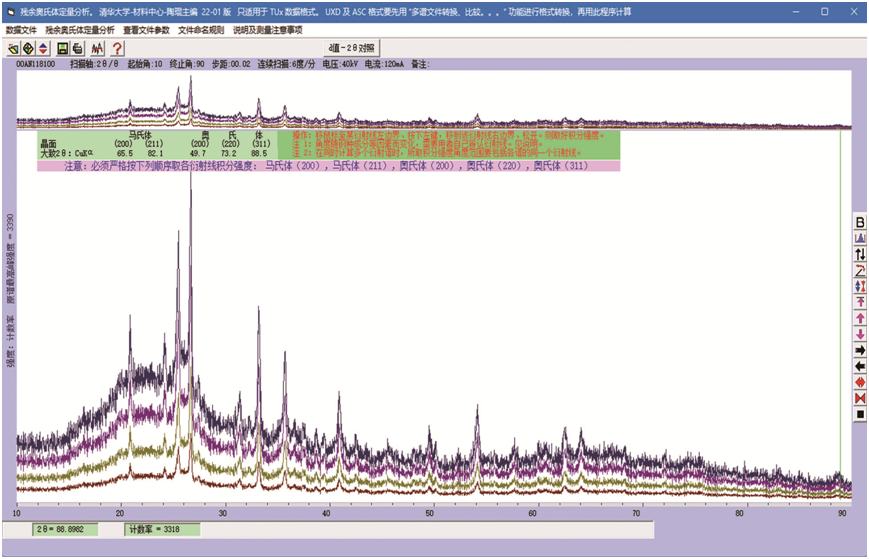
(3) Quantitative analysis of integral intensity by card k-method.
(4)Solid solution analysis problems.
(5)Lattice PARAMETERS ANALYZINGS-SELECTING SOMETHING IN multiphase SPECTRUM TO FIND ITS LATTICE PARAMETERS.
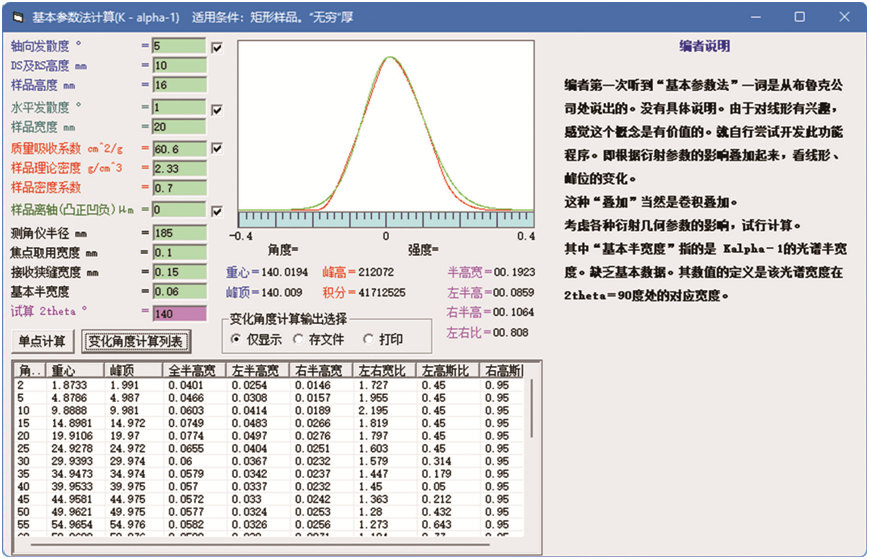
(6)Basic parameter method problem.
(7)Full spectrum peak separation function and its role in quantitative analysis.
(8)Overlapping peak separation problem.
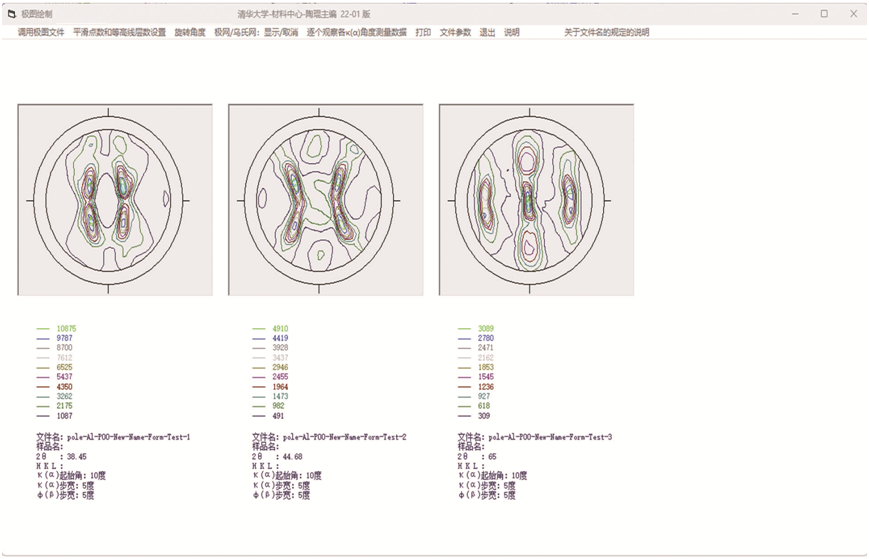
(9)Polar diagram.


